Calculation
Calculation
The calculations table shows all calculations for a transit. The most recent calculations are displayed first. Archived calculations are hidden by default and can be viewed again by removing the filter on the column Archived.
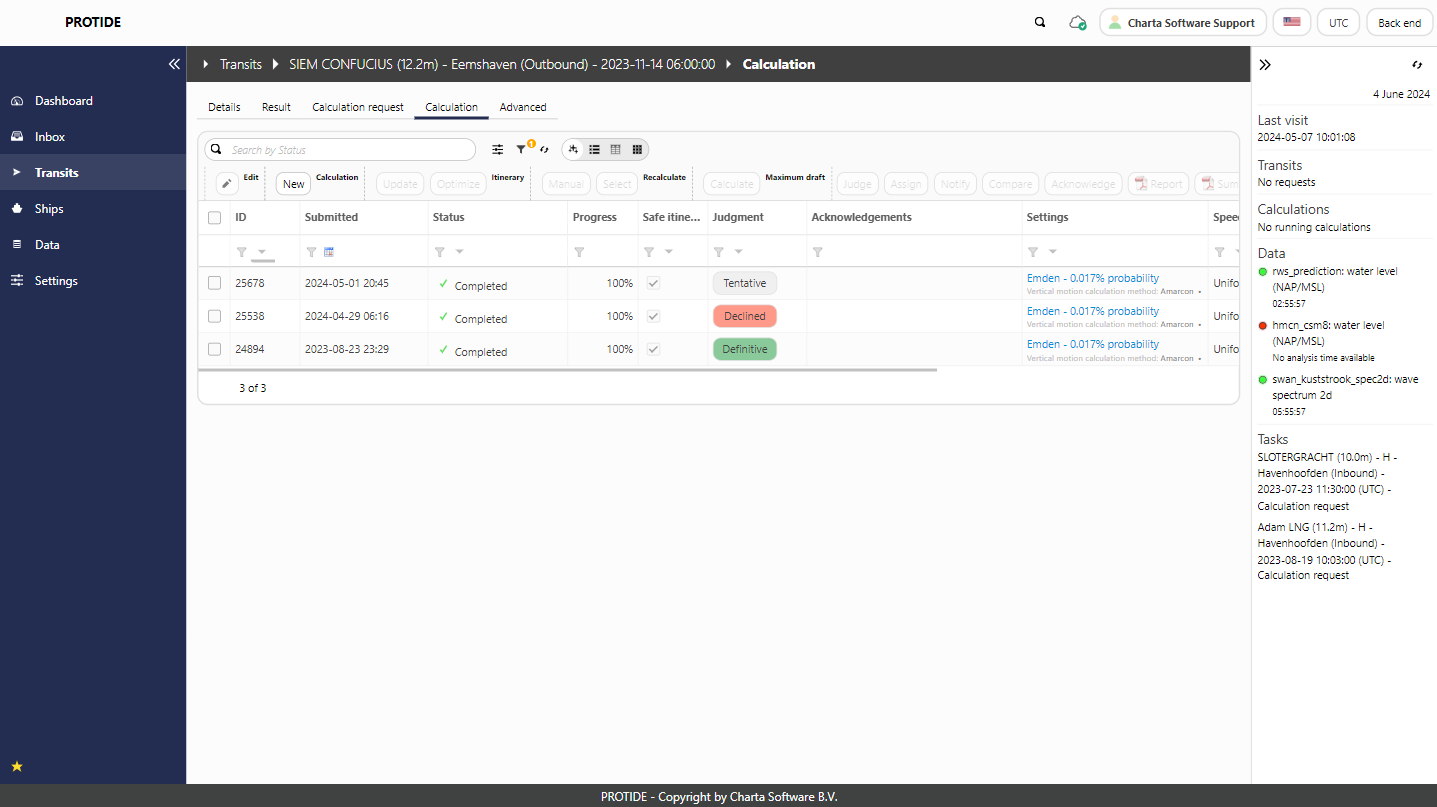
A calculation can be marked as archived with the Edit action. Clicking on a completed calculation opens the corresponding calculation report.
Calculation report
Based on the channel definition, ship details, expected conditions (water levels, waves, currents, wind) and speed, the under keel clearance, vertical motion and bottom touch probability are calculated. The calculation follows a safety analysis per location and time that determines local and global tidal windows. The results of the calculation are summarized in the calculation report and show the used data, intermediate results, tidal window(s) and detailed statistics.
The calculation report also shows the latest information on the hydro meteo data. By showing information about both, differences in hydro meteo data can immediately be noticed. This could be used to conclude whether a recalculation is necessary.
Tidal window
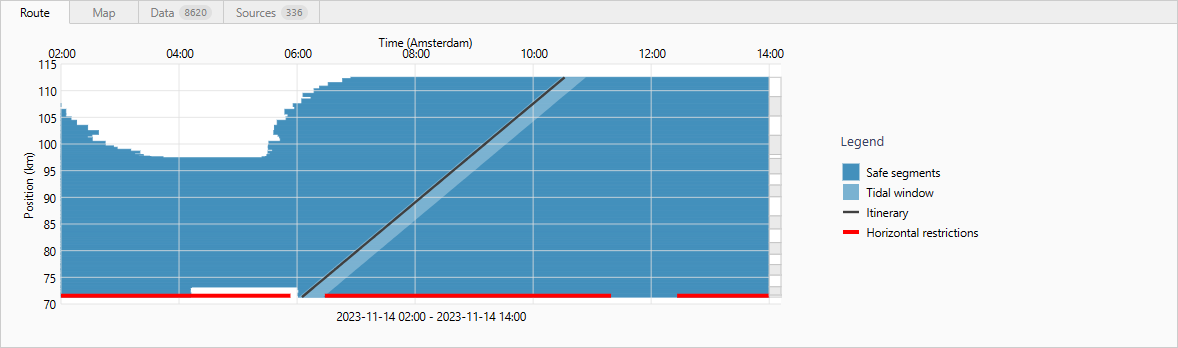
The time-location diagram displays local and global tidal windows. A local tidal window considers the passage of one specific location and the corresponding safety criteria. A global tidal window gives a time window where the entire route can be traveled safely with the proposed speed regime. The global tidal window is determined using the local tidal windows, and an additional global probability of bottom touch. If a global tidal window exists, a reference route is displayed in the time-location diagram. And if available, information from AIS data.
The trajectory, AIS route (if available), data sources and local statistics are available under the Map tab. Clicking on a segment shows the local statistics at the time of passage (see the figure below). If the itinerary is adjusted, these statistics will also be updated.
The intermediate results are given in either meters, degrees (roll and pitch) or percentages (bottom touch probability). Both the average values and percentile values (concerning the result after application of modeled variation (uncertainty)) are shown.
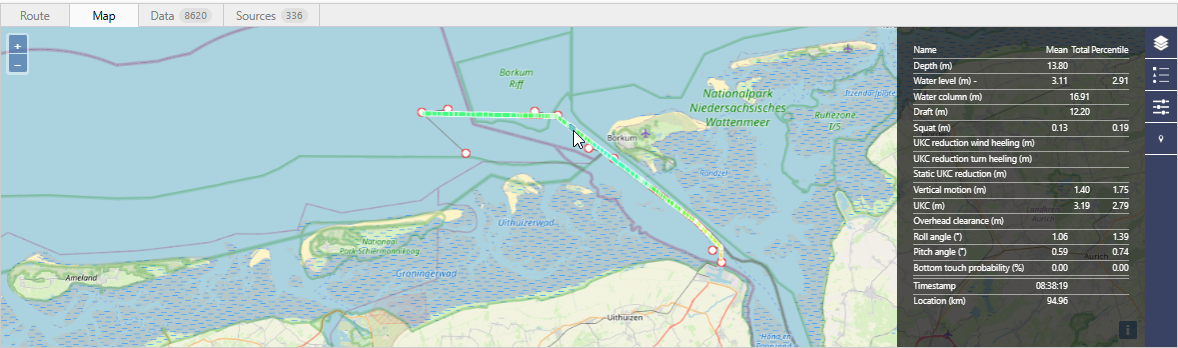
The water column equals the sum of the depth of the segment and the corresponding water level. The Static UKC reduction (m) is the sum of the squat and reduction by heeling due to wind and turning. The value at UKC (m) gives the static keel clearance minus all corrections and is calculated by subtracting the draft, static UKC reduction and vertical motion as a response to the waves of the water column.
The intermediate results (per evaluated time/location point) are also available in table form under the Data tab and can be downloaded for further analysis. The Sources tab displays the used data sources for each relevant kilometer position. A Validation tab is present only if the calculation result is validated. This tab gives insight into the performed validation checks. Note that the validation of the calculation result is only performed when the calculation is being judged to be definitive.
In addition, a number of graphs and diagrams are available within the calculation report. These graphs and diagrams will be explained in the upcoming sections.
Tide
The Tide diagram shows the water level at a predefined location on the route. The water level used in the calculation is indicated by a continuous line, the latest available data is indicated with a dashed line. Furthermore, the cross current and corresponding restrictions (if set) are displayed. The current and its restrictions are exclusively shown in the diagram if a restriction on the current is set on exactly that location.
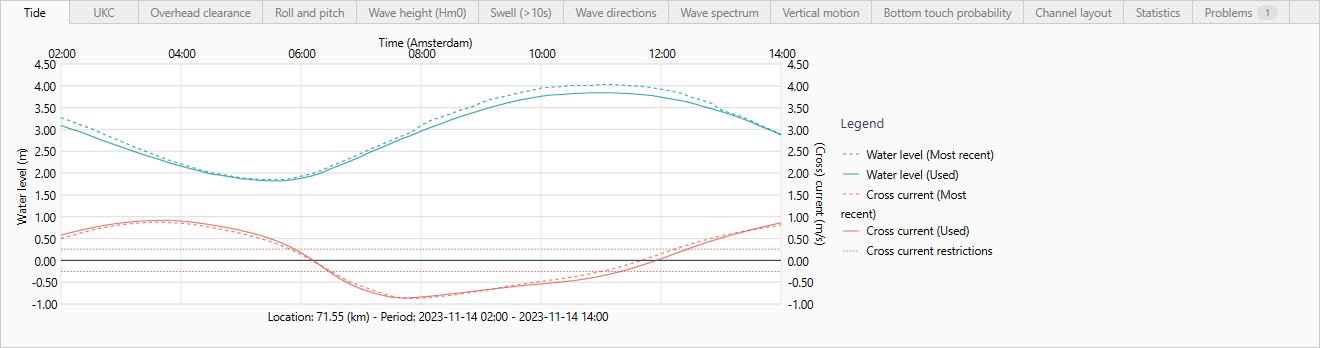
The cross current is determined as the perpendicular component of the current to the channel definition. The sign (positive/negative) of the cross current value indicates the orientation of the cross current to the segment. A positive value corresponds with a flow direction 90 degrees clockwise compared to the defined direction of the segment, a negative value to the opposite direction.
Under keel clearance
In the UKC diagram, the calculated under keel clearance is displayed with respect to the set safety criteria for the whole trajectory. The under keel clearance is calculated by adding the water level to the channel's depth minus the draft of the ship. Possible extra reductions are squat, heeling due to wind and heeling due to turning. In addition, there may be dynamic vertical motions due to wave response.
The calculated under keel clearance is displayed as a confidence interval and is based on the calculated average (upper limit) and the extreme percentile value (lower limit). This percentile value concerns the result after the application of modeled variation (uncertainty).
The safety criteria and calculated confidence intervals (before/after reductions) are calculated and displayed based on the chosen reference route. In the diagram three polygons are shown denoting the confidence intervals for respectively:
- Static keel clearance (UKC): Channel depth + forecasted water level - ship draft.
- Static keel clearance minus squat (UKC minus squat): Channel depth + forecasted water level - ship draft - squat.
- Dynamic keel clearance (UKC minus all corrections): Channel depth + forecasted water level - ship draft - squat - reductions due to heeling (wind/turn) - (2x significant amplitude of) the vertical motion as wave response.
Safety criteria based on absolute under keel clearance (before/after reductions) and relative under keel clearance (before/after reductions) are supported. Criteria based on absolute under keel clearance are evaluated against the percentile value of the confidence intervals (worst case). For example: "under keel clearance minus squat should be at least 1 meter", in this case the lower limit of the polygon UKC minus squat must be above the configured limit of 1 meter. Criteria based on relative under keel clearance are evaluated against the average value of the confidence intervals. E.g. "under keel clearance should be at least 10%". In this case the upper limit of the polygon UKC must be above the calculated limit of 10% of the draft of the ship. These criteria are evaluated as part of determining local tidal windows.
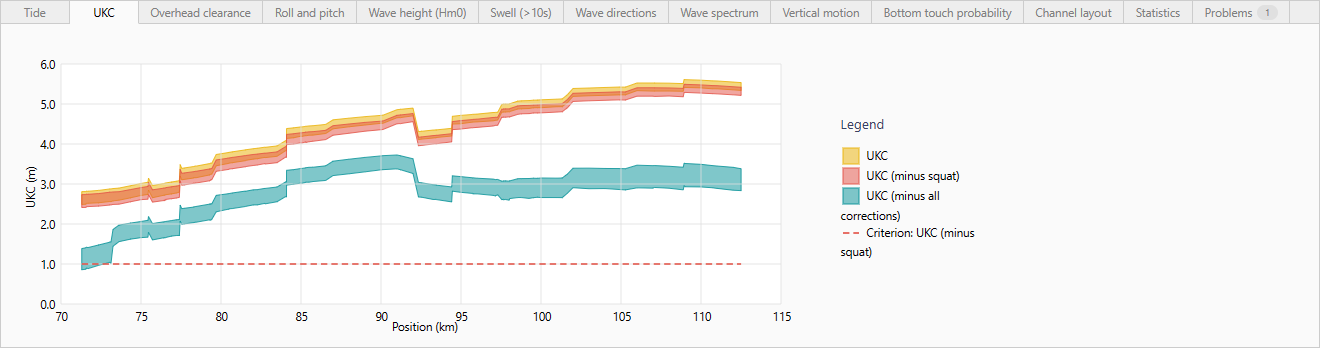
The under keel clearance diagram is based on the reference route. If the reference route is updated, this diagram will also be updated according to the new reference route.
Overhead clearance
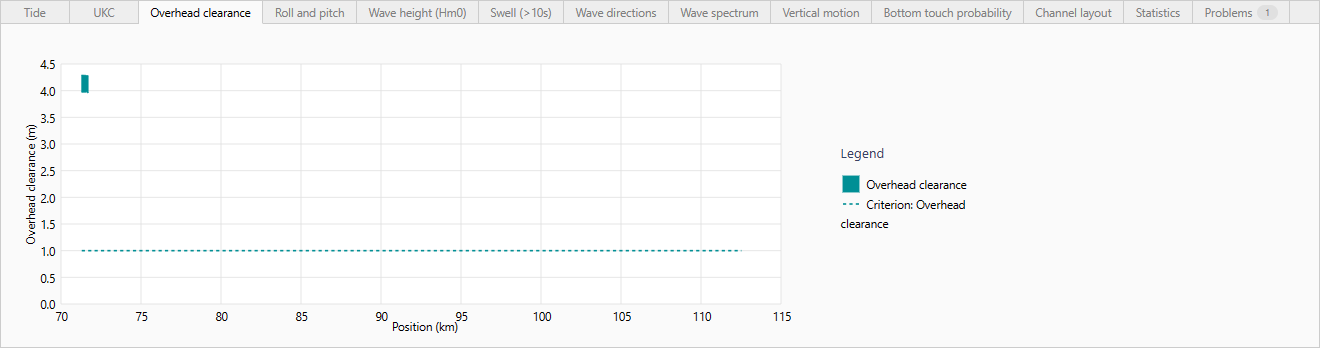
In the Overhead clearance diagram, the calculated overhead clearance is displayed with respect to the set safety criteria. The overhead clearance is calculated by correcting the segment's height for the water level and then subtracting the air draft of the ship.
The calculated overhead clearance is displayed as a confidence interval and is based on the calculated average (upper limit) and the extreme percentile value (lower limit). This percentile value concerns the result after the application of modeled variation (uncertainty).
The safety criteria and calculated confidence intervals are calculated and displayed based on the chosen reference route.
Safety criteria based on absolute static overhead clearance and relative static overhead clearance are supported. Criteria based on absolute static overhead clearance are evaluated against the percentile value of the confidence interval (worst case). For example: "overhead clearance should be at least 1 meter", in this case the lower limit of the area in the diagram must be above the configured limit of 1 meter. Criteria based on relative static overhead clearance are evaluated against the average value of the confidence intervals. E.g. "overhead clearance should be at least 10%". In this case the upper limit of the area in the diagram must be above the calculated limit of 10% of the air draft of the ship. These criteria are evaluated as part of determining local tidal windows.
Roll and pitch
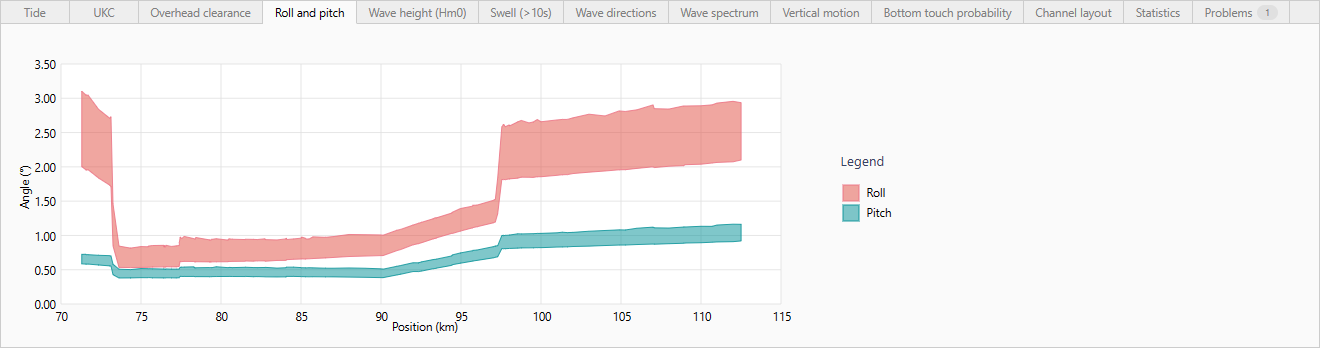
The Roll and pitch diagram shows the calculated roll and pitch angles for the reference route. The calculation of the roll and pitch considers the environmental conditions as well as the ship's response to the waves. The associated motions are displayed as twice the significant vertical motions, which corresponds to the expected extremes. Moreover, the calculated average (lower limit) and the percentile value (upper limit) are used to draw a confidence interval.
Wave height
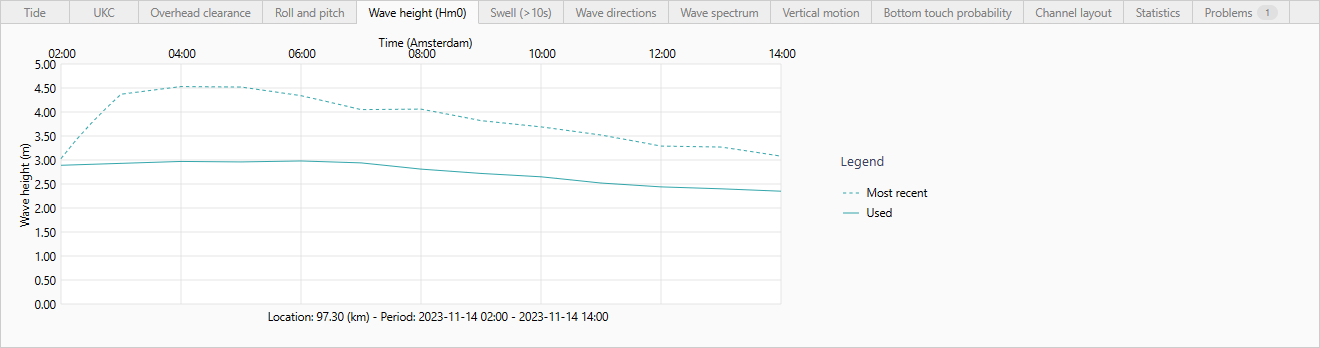
In the Wave height (Hm0) diagram, the wave height (Hm0) is displayed for a predefined location on the route (continuous line), as well as the latest available data (dashed line).
Swell
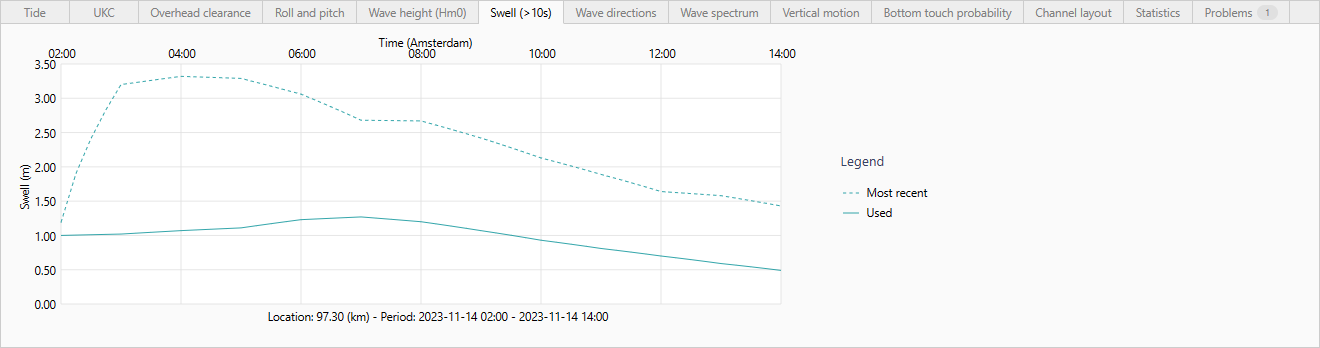
In the Swell (>10s) diagram, the swell height (He10) is displayed for a predefined location on the route (continuous line), as well as the latest available data (dashed line). The height of the swell is based on waves with a period of over ten seconds.
Wave directions
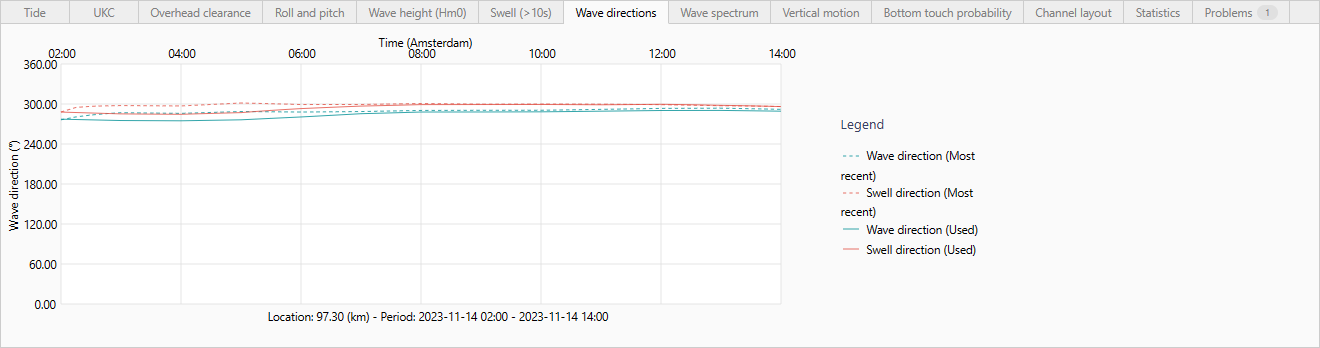
In the Wave directions diagram, the direction of the wave height (Hm0) and swell (He10) is displayed for a predefined location on the route (continuous line), as well as the latest available data (dashed line).
Wave spectrum
In the Wave spectrum diagram, the wave spectrum is displayed for a predefined location on the route at the passage time of this location.
The wave spectrum is visualized by a radar plot. The direction of the radar plot shows the direction from which the waves come. The distance to the center specifies the frequency of the wave and the color indicates the intensity of the wave. In the example below, waves arrive from the West, in particular with a frequency between 0.10 and 0.16 Hertz.
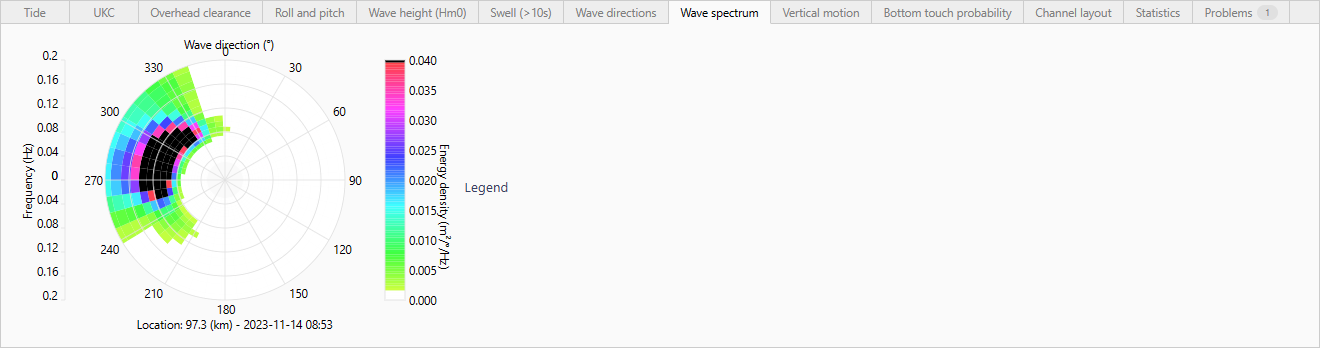
The wave spectrum diagram depends on the chosen reference route. If the reference route is updated, this diagram will also be updated according to the new reference route and will show the wave spectrum of the new passage moment.
Vertical motion
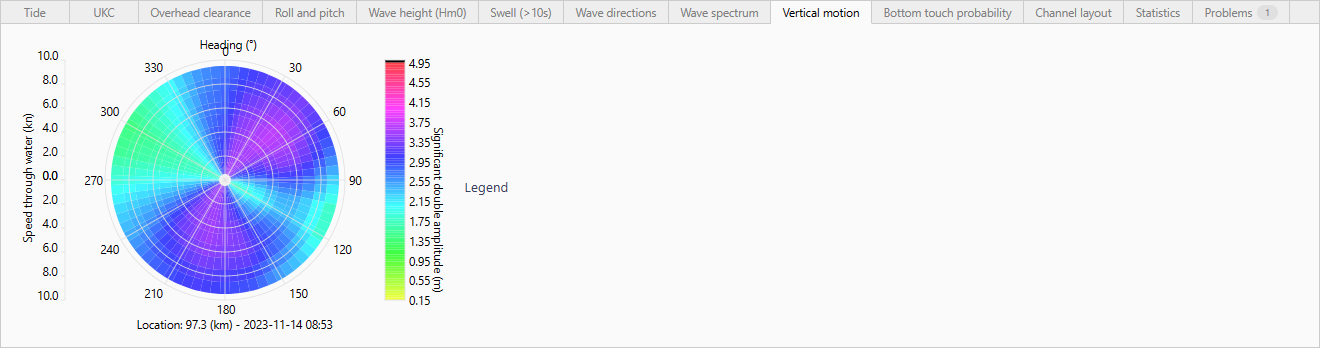
In the Vertical motion diagram, the total vertical response on the waves (as shown in the wave spectrum diagram) is displayed for a predefined location on the route at the passage of this location. This spectrum is also visualized by a radar plot. Updating the reference route directly affects the diagram, as with the wave spectrum diagram.
The calculation of the total vertical ship's response follows from OCTOPUS. It calculates using strip theory, the Response Amplitude Operator (RAO) for a specific ship (hull, dimensions), and its load-specific stability data such as GM and GG'. In combination with the environmental conditions (sea state) the (vertical motion) response can be estimated. The maximum vertical motions are visualized by the radar plot. From this diagram, depending on the speed and course, the value of the significant double amplitude can be read. For example, if the ship travels to the South, a vertical motion of around two meters is expected for all displayed speeds. In this case, the waves come from an unfavorable angle relative to the heading of the ship.
Bottom touch probability
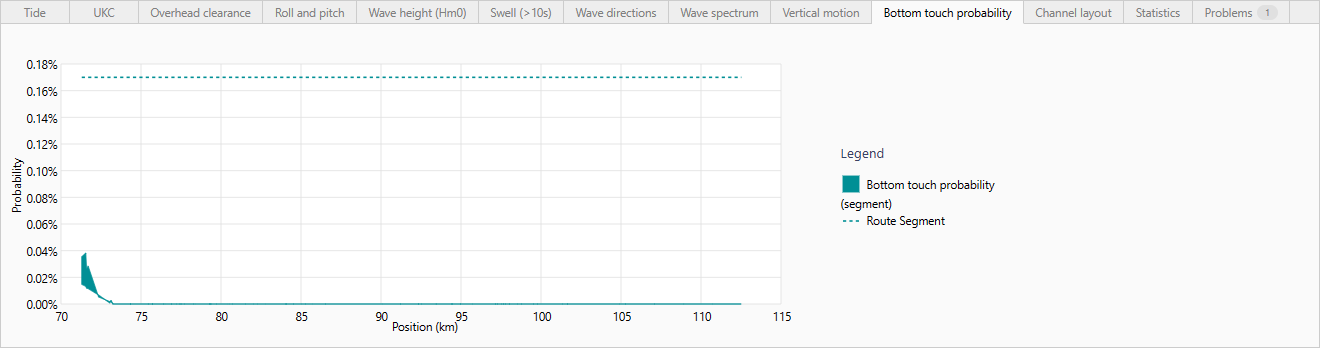
During the calculation, the bottom touch probability is determined for each location based on the specified circumstances and the corresponding variations. The bottom touch probability is equal to the probability that a point of the ship will have a larger vertical motion downwards than there is keel clearance.
In the Bottom touch probability diagram, the confidence interval (shown as a polygon) at each location is displayed between the average and percentile values, along with the criterion evaluated against (dashed line). The global chance of bottom touch (route) is equal to the area under the drawn polygon.
Channel layout
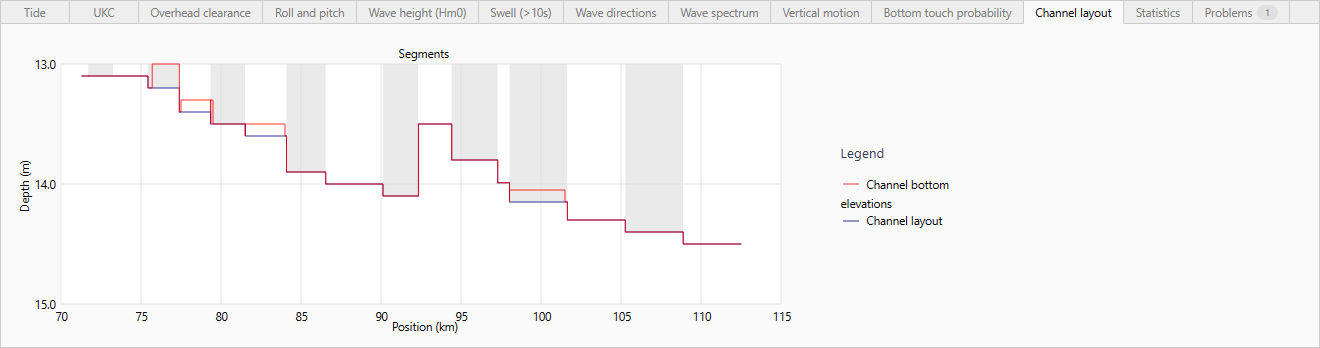
If bottom elevations are taken into account in the calculation, an additional tab Channel layout will be displayed in which the channel profile is visualized as well as the prevailing bottom elevations.
Statistics
In the Statistics tab, an overview of the details of the transit (e.g. ship and stability figures, speed regime) and the calculation settings is displayed. At predefined (significant) passage points, the open and closure times for the tidal window are given. The expected passing times for the selected reference route are also given for these points. Subsequently, some statistics on the calculation are given.
Problems
Any problems detected during the calculation are displayed in the Problems tab. An example of such a problem may be that no correction can be made to the wave spectrum, or that there is no data available for part of the period.
Actions
Several actions can be executed on completed calculations. These are available on the calculations table.
Add
Add a calculation. The calculation settings as well as the speed regime can be selected from a predefined list, default values of the start of the calculation period and the horizon are given and can be adjusted as desired. Furthermore, it is possible to use manual data overrides within the calculation or to include bottom elevations in the calculation.
Edit
Edit a calculation to be active or archived.
Calculate (Maximum draft)
Start a new calculation that estimates the maximum draft of the transit for the given itinerary and the specified tidal window width.
Manual (Recalculate)
Perform a recalculation with the option to adjust the time of departure, and to adjust, add or remove wait locations and associated wait times. In the form, the current wait locations are shown, including the default wait locations of the transit that are not in the route (with wait time = 0 minutes).
Select (Recalculate)
Provides a list of several route options to choose from. The options are aimed at arriving with a (safe) route with sufficient margin based on, for example, the current time of departure or the desired start time of the transit. A maximum of eight options are offered where equal options are shown only once.
The safe route options are determined by finding a tidal window with the minimum desired margin. If the time of departure is adjustable, a tidal window will first be searched after the given start time, and then (if necessary) before the given start time. The following eight options are supported.
- Current time of departure, current itinerary (i.e. the current route).
- Requested time of departure, current itinerary.
- Safe route based on current time of departure, current itinerary.
- Safe route based on requested time of departure, current itinerary.
- Route with alternative wait time based on current time of departure.
- Alternative wait time route based on requested time of departure.
- Safe route based on current time of departure with alternative wait time.
- Safe route based on requested time of departure with alternative wait time.
Note: Route options with alternative (variable) wait times are only supported when there is exactly one wait location where variable wait time is configured.
Compare
Provide a comparison of the tidal window diagrams of the selected calculations.