Result
Result
The transit result page provides an overview of the calculation results for the transit. By default, this page shows the results from the latest completed calculation by judgment priority (definitive over indicative/tentative over declined), excluding archived calculations. It is also possible to select a different calculation for the transit. A hint will be displayed if the selected calculation is not the latest calculation. The components of the result page are described in the following sections.
Overview
A table with the main calculation results for all significant positions. It shows the planned itinerary, the opening and closing moments of the tidal window and the static and dynamic under keel clearance.
Map
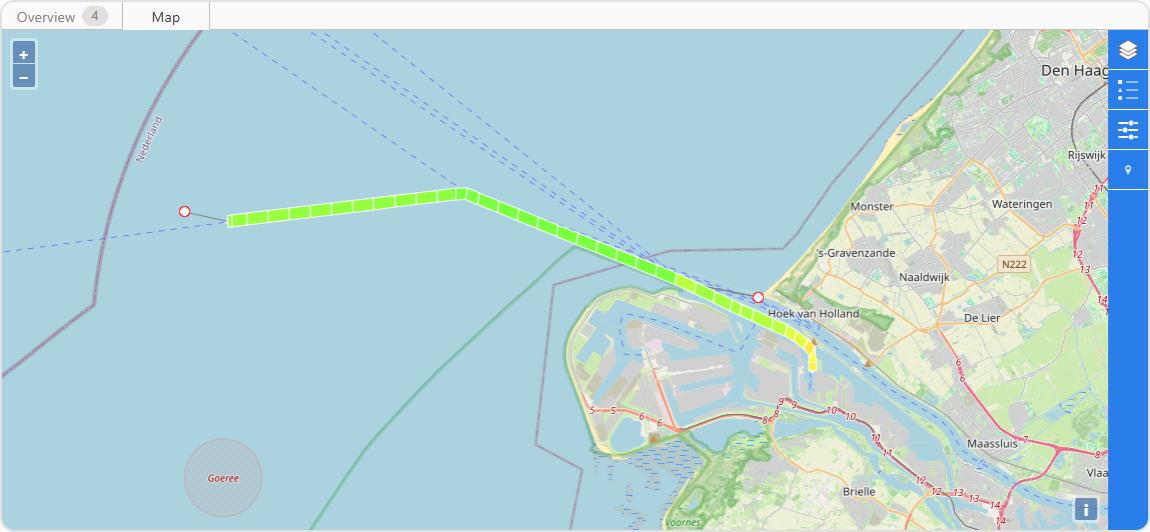
A map that displays the route, coupled data sources and calculated location statistics. The location statistics layer visualizes the underkeel clearance along the planned itinerary. Other statistics are available by clicking on a segment in the location statistics layer.
If present, the map also displays AIS data and measurement data.
Tidal window
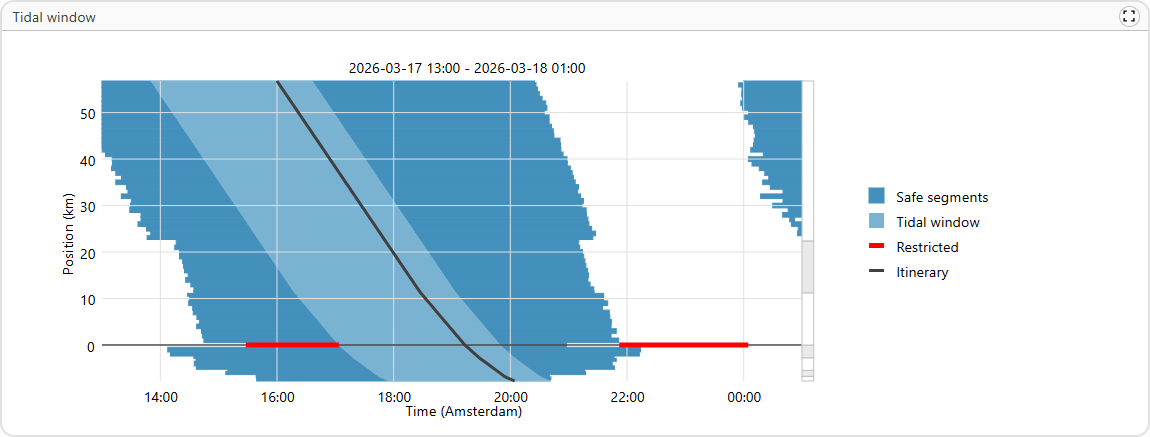
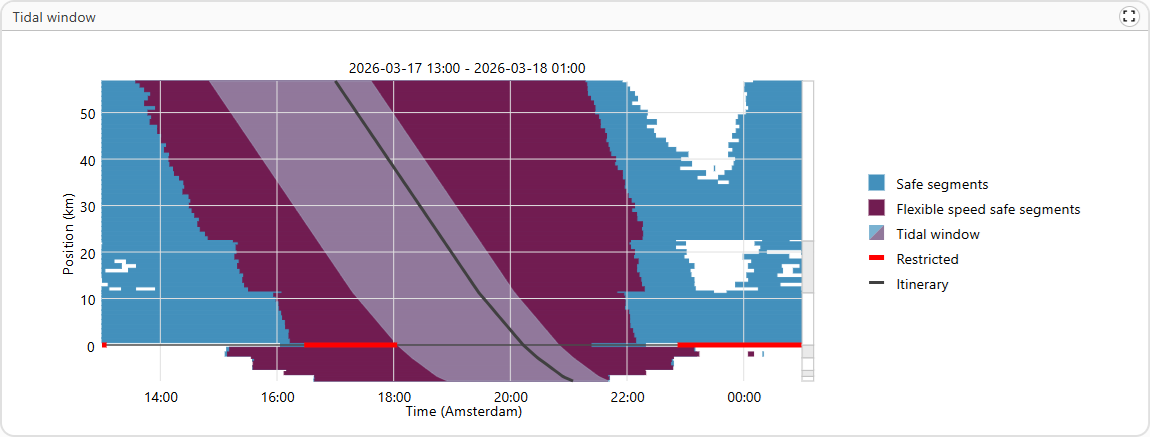
A diagram that displays the local and global tidal windows. A local tidal window considers the passage of a specific location for the corresponding safety criteria. A global tidal window gives a time window where the entire route can be traveled safely with the proposed speed regime. The diagram also visualizes the planned itinerary and configured data restrictions.
Route statistics
Diagrams for calculated statistics along the planned itinerary. Depending on the calculation settings and safety criteria, diagrams are available for the under keel clearance, overhead clearance, roll and pitch, bottom touch probability, vertical motion, speed, and squat.
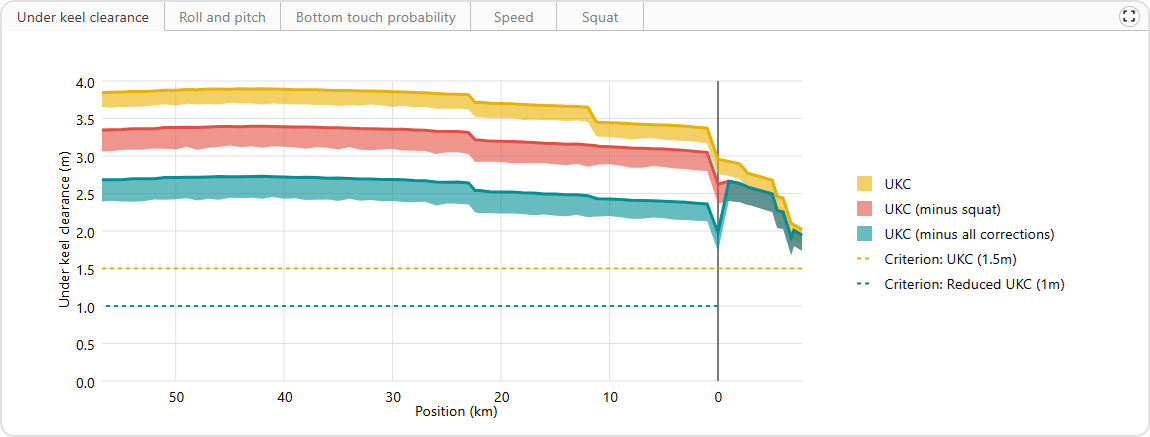
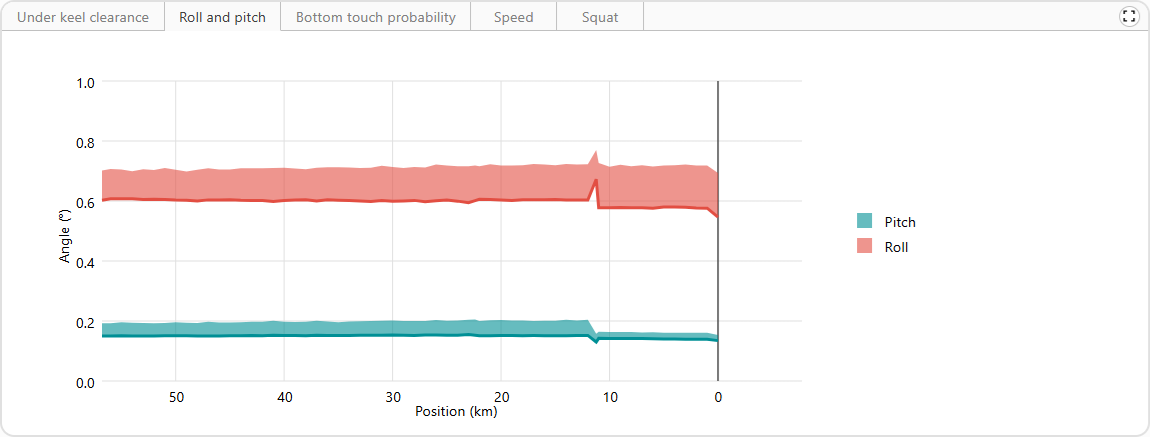
Route statistics are calculated through the application of modeled variation. For each statistic, both the mean and the worst-case percentile are recorded. This range is visualized in diagrams with a semi-transparent bandwidth, with the mean emphasized by a bold line.
Under keel clearance
A diagram that displays the calculated under keel clearance along the planned itinerary. Three types of under keel clearance are calculated:
- UKC is the static keel clearance: the water depth minus the ship's draft, including the current water level.
- UKC (minus squat) subtracts the ship's squat from the static keel clearance.
- UKC (minus all corrections) is the dynamic keel clearance: it further reduces the clearance by accounting for vertical motion and heeling.
The diagram also displays the configured safety criteria for under keel clearance. Safety criteria can be defined for each type of under keel clearance and can based on either absolute or relative under keel clearance. Absolute criteria are evaluated against the lower bound of the confidence intervals (worst-case percentile value). Relative criteria are evaluated against the mean of the confidence intervals. These criteria are applied when determining local tidal windows.
Roll and pitch
A diagram that displays the calculated roll and pitch along the planned itinerary. The values represent the significant double amplitude for the roll and pitch.
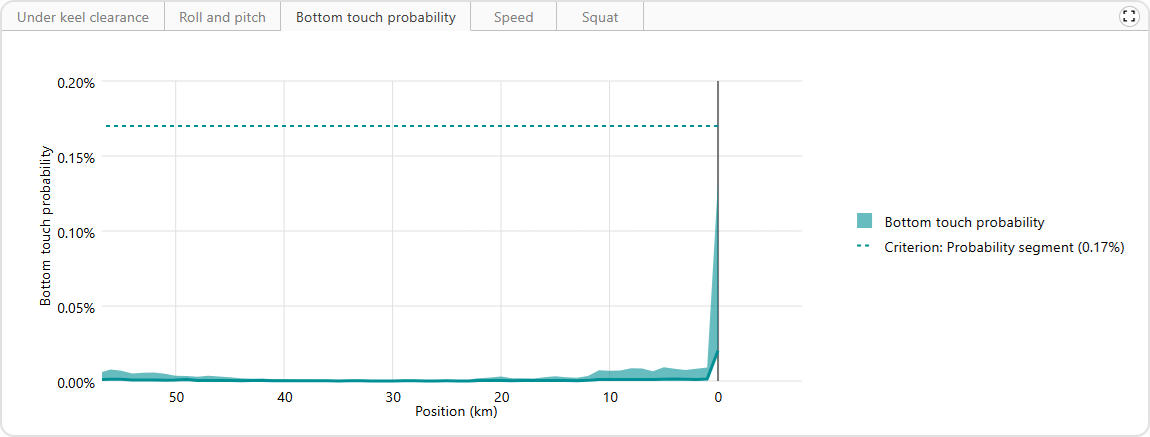
Bottom touch probability
A diagram that displays the calculated bottom touch probability along the planned itinerary. The bottom touch probability represents the chance that selected points on the ship will move downward more than the available keel clearance.
The diagram also displays the configured safety criteria for bottom touch probability. It is configurable whether the criteria are evaluated against the mean or the worst-case percentile value. These criteria are applied when determining local tidal windows.
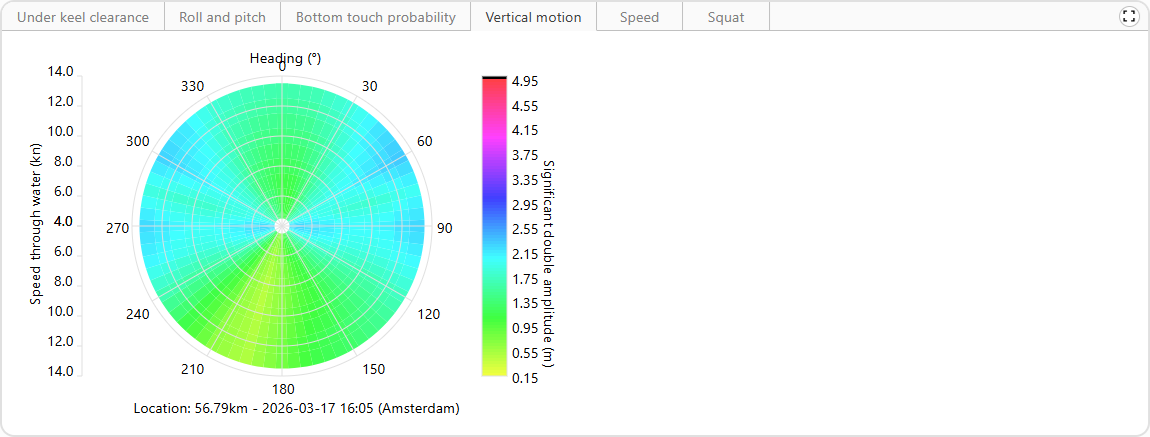
Vertical motion
A polar diagram that displays the vertical motion per speed and heading. The diagram shows the vertical motion for the passage time of a predefined location.
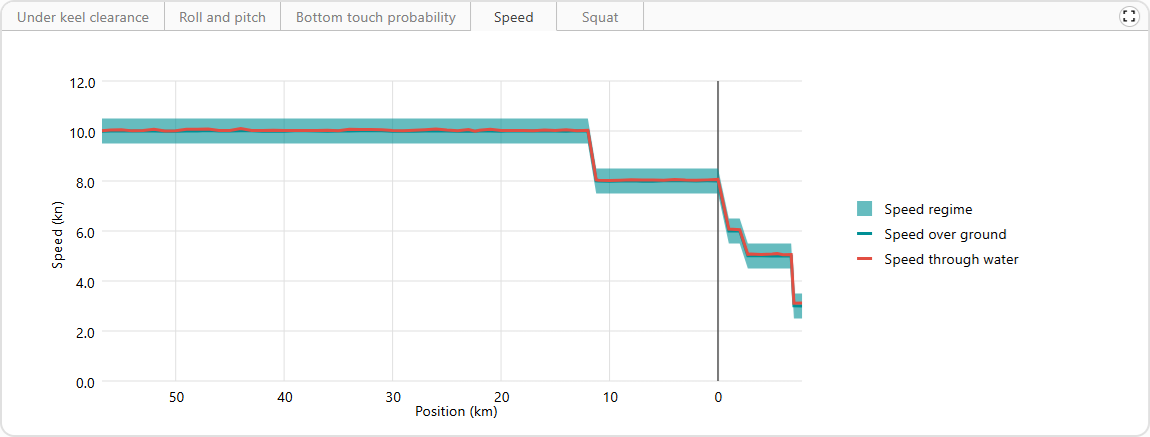
Speed
A diagram that displays the speeds that were used in the calculation. It includes lines for the mean speed over ground and the mean speed through water along the planned itinerary.
The diagram also visualizes the speed regime for the calculation as a semi-transparent bandwidth.
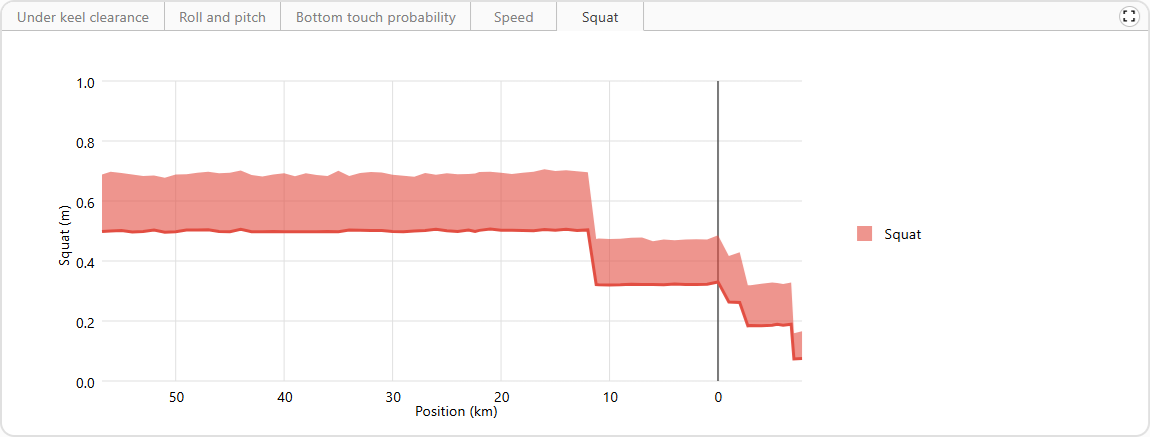
Squat
A diagram that displays the calculated squat along the planned itinerary. The squat is computed based on the speed through water. Different squat calculation methods are supported.
Data
Diagrams for the data used in the calculation. Depending on the calculation settings and safety criteria, diagrams are available for tide, wave height, wave spectrum and channel layout.
Tide
A diagram that presents tide-related information for the calculation period at a predefined location on the route. It presents both the data used in the calculation and the most recent available data.
The diagram shows the water level and (if available) the cross current. If current restrictions are applied in the calculation, the current is included as well.
The diagram also displays the configured (cross) current restrictions at the selected location. These restrictions are applied when determining local tidal windows.
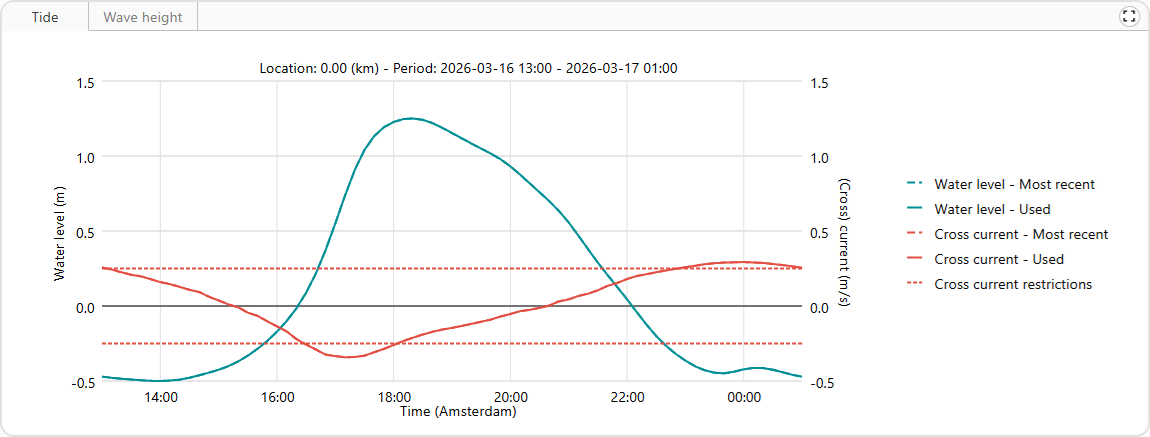
The cross current is the component of the current perpendicular to the channel direction. Its sign indicates the orientation relative to the segment: a positive value represents a flow 90° clockwise from the segment direction, while a negative value represents a flow in the opposite direction.
Wave height
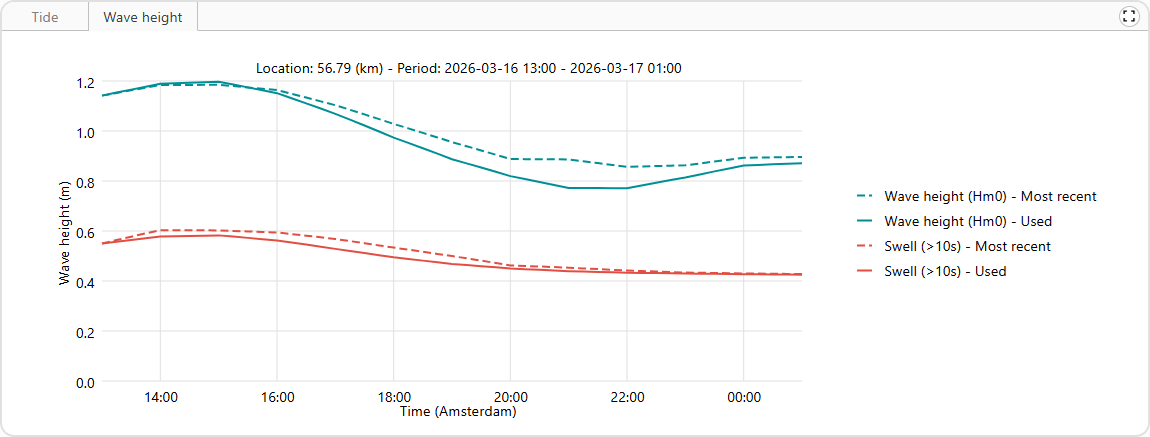
A diagram that displays the wave height (Hm0) and swell (HE10) for the calculation period at a predefined location on the route. It presents both the data used in the calculation and the most recent available data. The swell height is based on waves with a period over ten seconds.
The diagram also displays the configured swell restrictions at the selected location. These restrictions are validated when judging a calculation as definitive.
Wave spectrum
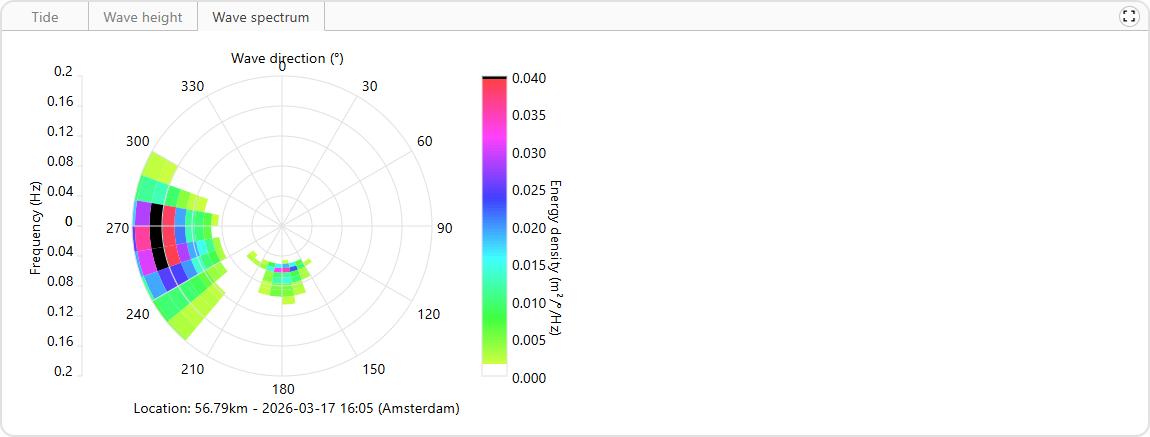
A polar diagram that displays the wave energy density per frequency and direction. The diagram shows the wave spectrum data for the passage time at a predefined location on the route.
Channel layout
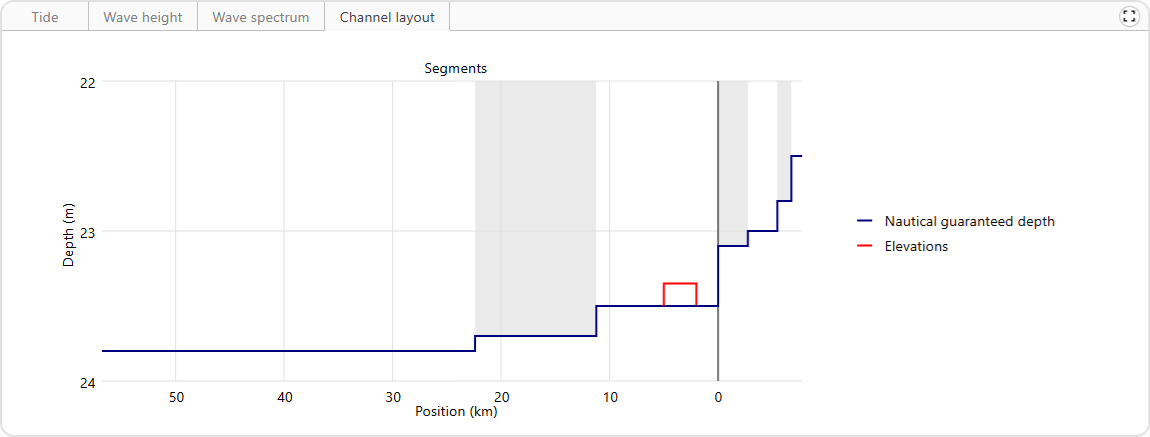
A diagram that displays the segment depths and active channel bottom elevations.
Validation
A table with the results of validation checks for the calculation. It shows whether each check has passed, and lists warnings in case of failure.
These checks are performed when the calculation is judged as definitive. The table is therefore only available for definitive calculations.
The following checks are performed:
- The calculation definition is consistent with the transit: the ship dimensions, route, calculation settings, speed regime and data restrictions haven't changed since the calculation was performed.
- The validation rules for maximum data age in the port/route configuration are satisfied.
- The validation rules for ship dimensions in the global/port/route configuration are satisfied.
- The validation rules for ship stability parameters in the global/port/route configuration are satisfied.
- The validation rules for calculation settings in the port/route configuration are satisfied.
- The validation rules for swell restrictions in the port/route configuration are satisfied.
- The calculation was created within six hours of the itinerary start.
- The calculation has a tidal window.
- The calculation has a safe itinerary.
- No problems were encountered during the calculation.
Acknowledgments
A table listing the provided acknowledgments for the calculation. It shows the user and the comment for each acknowledgment.
The table is only available when the calculation has been acknowledged at least once.
Details
General information about the transit and the calculation. This includes the ship dimensions, draft, stability parameters, calculation settings and speed regime used in the calculation.
Actions
Judge
Judge the calculation as indicative, definitive or declined. By default, a calculation has a tentative judgment.
A warning will be given if the calculation is assigned to a calculation request.
When judging the calculation as definitive, additional validation checks are performed. An overview of these checks can be found in the description of the Validation table.
Acknowledge
Provide an acknowledgment for the calculation.
An overview of all acknowledgments can be found in the Acknowledgments table.
Assign to calculation request
Assign the calculation to a calculation request.
The action is only available when the calculation is judged as indicative or definitive, and the corresponding transit has a calculation request.
Send an e-mail with the calculation PDF report (summary or extended) attached. The content of the e-mail can be customized per port based on a template. If no template is configured for a port, a default e-mail template will be used for this action.
Default recipients of the e-mail can be configured per port. Recipients can be added or removed from the predefined list.
Download PDF report/summary
Download the calculation PDF report (full report or summary). The content of the report can be customized per port based on a template. If no template is configured for a port, a default report template will be used for this action.
Update itinerary
Update the itinerary of the calculation to pass a selected location at a given time. A warning will be given if the new itinerary is not safe.
Optimize itinerary
Optimize the itinerary of the calculation based on a selected calculation statistic. The most critical location along the route is used to determine the optimal itinerary.
Special calculations
Flexible speed interval
When a flexible speed interval is configured, the Tidal window diagram displays two types of safe segments. Normal safe segments (blue) are calculated for the configured speed regime, which defines a target speed (and spread) for each part of the route. Safe segments for flexible speed (purple) are calculated for the entire range of speeds in the configured flexible speed interval.
In other words, blue segments indicate if the vessel can safely navigate at the target speeds from the speed regime, while purple segments indicate if the vessel can safely navigate at any speed within the flexible interval.
Flexible speed intervals can be configured per port in the Settings > Calculation settings > Flexible speed intervals module.
Associated routes
When associated routes are calculated, the Tidal window diagram shows a restriction line for each route. The line is placed where the associated route diverges from the original route, and indicates when it would be unsafe to start the associated route. Restrictions for associated routes do not affect the global tidal window(s) of the calculation.
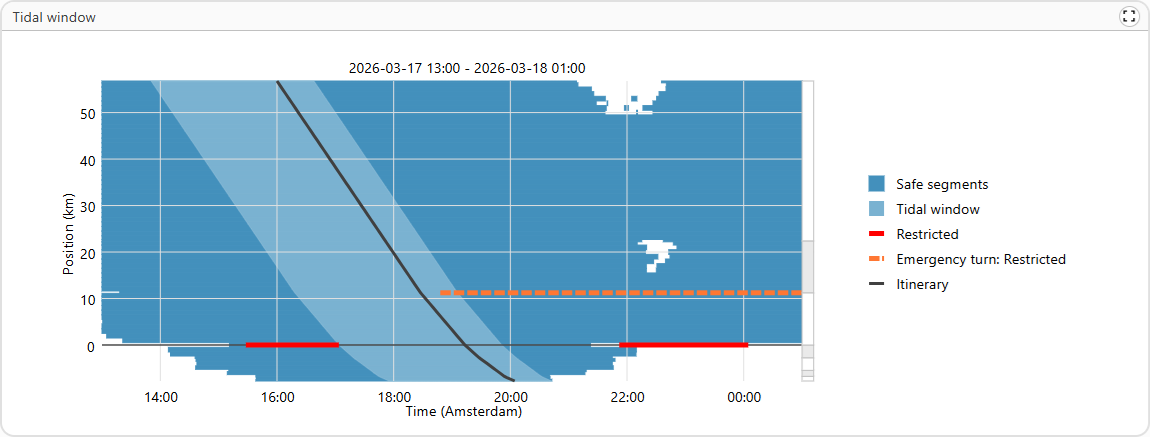
The opening and closing moments of tidal windows for associated routes can be found in the Associated routes table. This table also shows the starting position and time for each associated route.